SOL Technical Analysis
On the Solana side, as of April, the most notable development has been a major liquidity provider choosing Solana as its preferred network. In this decision, liquidity protocols like Meteora operating on Solana play a key role by offering more efficient and sustainable liquidity solutions. This stands out as an important signal that liquidity is starting to shift from other networks into the Solana ecosystem.With this development, Solana is no longer just attracting users but also liquidity. Let’s look at how this increasing liquidity flow is reflected in price action on the technical chart.
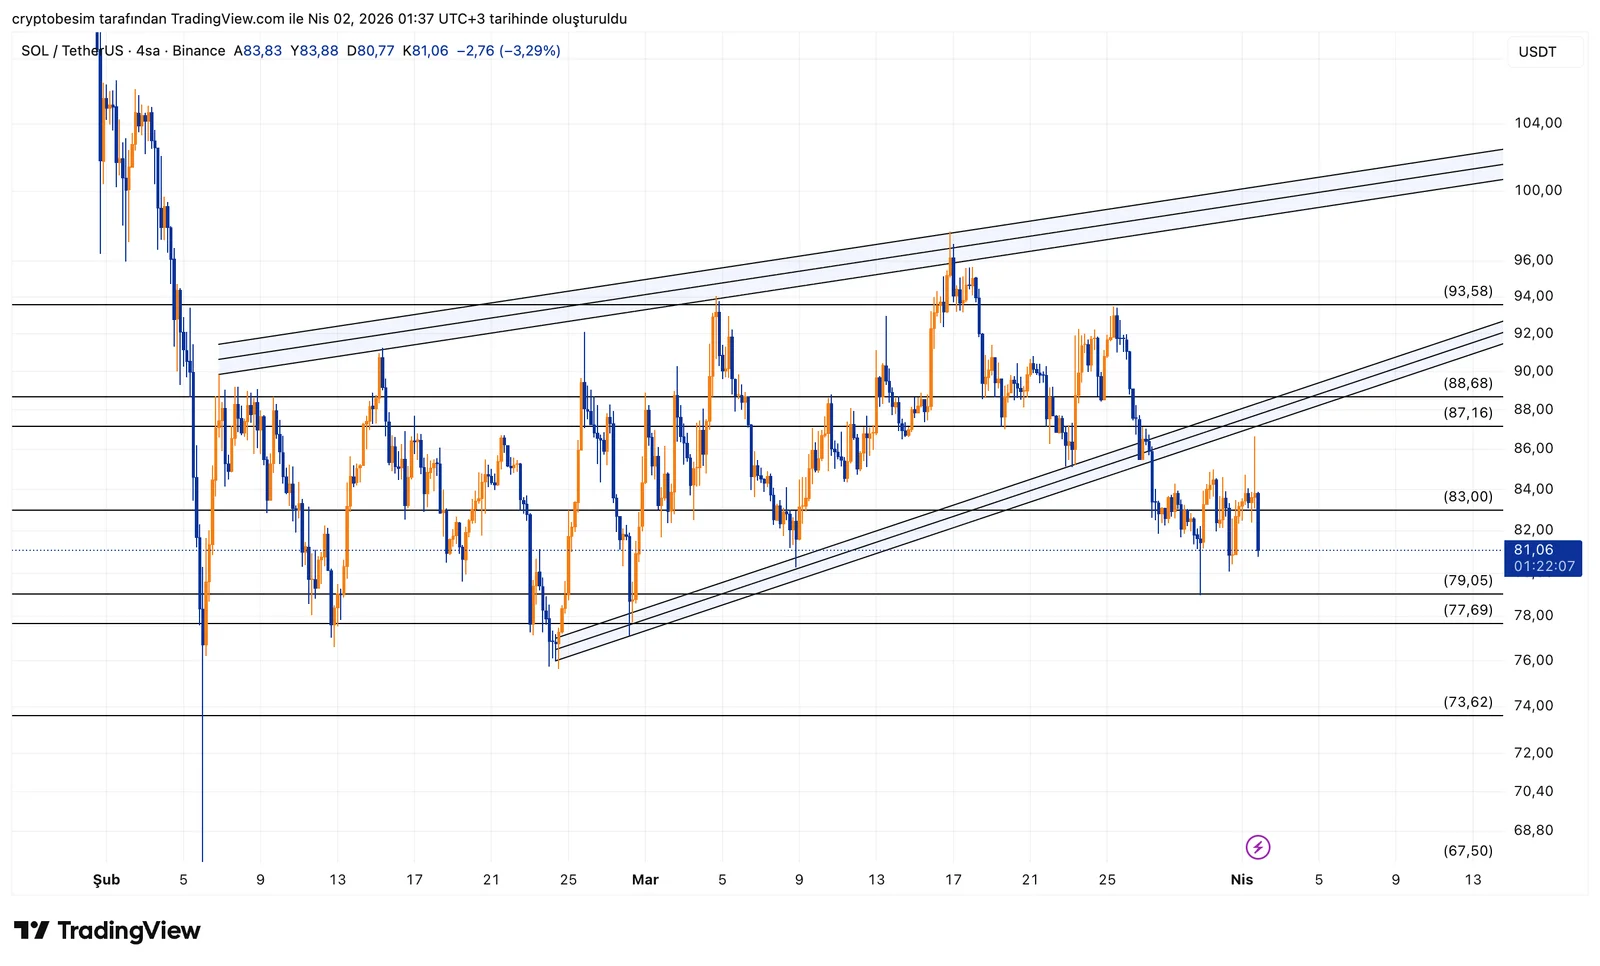
After the rising wedge structure broke to the downside, price followed a classic scenario. The breakdown occurred, then price moved back up to retest the broken level and got rejected again. The retest worked, confirming the continuation of the downward move.
Currently, price remains below the previous structure, indicating that the weak outlook continues in the short term. Especially the inability to move back inside the wedge is important.
At the current level, the 79–83 range acts as a short-term support zone. However, the previously broken trend region above has now turned into resistance.
If price produces a reaction from here, the first move could be toward that broken trend area. But the key factor will be whether it can reclaim that level.
- As long as price stays below the broken wedge structure, pressure continues
- The post-retest rejection confirmed the downside move
- The 79–83 range is a short-term support zone
- If this area is lost, the downward move may deepen
- On the upside, the first strong resistance is the broken trend region
These analyses do not provide investment advice and focus on support and resistance levels that are considered to offer short- and medium-term trading opportunities depending on market conditions. However, responsibility for execution and risk management lies entirely with the user. In addition, the use of stop loss is strongly recommended.